News & Commentary
Why Do Metrics Matter?

Nothing seems to make eyes glaze over faster than the discussion of measurement and data metrics. For someone working outside the world of data this topic can appear dry and technical; however, metrics are crucial to our basic understanding of how our public institutions of higher education are funded, whether students are able to attend, and whether institutions are doing a good job at graduating students with meaningful degrees. A recent public opinion poll found that over three quarters of Californians think the higher education system is important to the economic vitality of the state. However, respondents were divided about whether they think the system is heading in the right direction. Making consistent and relevant data available on funding, access, and performance can shed a light on whether these systems are heading in the right direction. [1]
When data is collected in an inconsistent way it can lead to confusion about funding realities and mislead institutions, policymakers, and the public about opportunities and tradeoffs.
For example, there has been widespread coverage of California “disinvestment” in higher education in the last 25 years. The degree of that disinvestment depends upon how state funding to the institutions is measured. Total state funding for higher education has more than doubled in the last quarter century. However, if you adjust state funding for inflation and also for the increased enrollment in higher education, state funding per student has decreased by 42%.
Inconsistent metrics also make it difficult to weigh different funding options and evaluate the consequences of each. Should we spend more on financial aid or increasing salaries for professors? Without tracking the amount we spend on each and the cost of increasing each by, say, one percentage point, it is difficult to analyze these tradeoffs.
Another crucial reason that we need consistency in measurement is to ensure that institutions are treated equivalently. The CSU and UC systems both play extremely important roles in California’s higher education landscape, but because employee benefits are authorized in a separate area of the budget for the CSU it is difficult to tell if the two systems are receiving parallel treatment for this important expenditure.
The discrepancies between UC and CSU application and enrollment data illustrate that inconsistent metrics make side-by-side comparisons impossible. While both institutions track the number of applicants, the number of admitted students, and the number of enrolled students, CSU also provides data on the number of applications that were incomplete and the number of qualified applicants that were not admitted. Comparing the number of incomplete and/or denied eligible applicants at CSU and at UC would provide valuable data about capacity issues. Similarly, the UC publishes data on the high school of origin of entering freshmen, but CSU does not. Examining the high school of origin for both systems would allow for an analysis of how well the institutions are meeting regional demands for higher education. Neither of these cross-system comparisons are possible because they do not collect parallel data.
Financial data are also not collected in a uniform manner. Both the CSU and UC have a set of revenues and expenditures that are considered “Core.” Core Revenues are used to fund the basic operations of running an institution, including paying salaries related to instruction, student counseling, and institutional support but does not include the support of auxiliary enterprises. However, there is no common definition of Core Revenues or Core Spending. In fact, while the CSU’s Core Revenues are from only two sources—state dollars and student dollars (tuition and fees)—the UC adds a third funding stream to the mix called UC General Funds, mostly comprised of tuition and fees of nonresident students. Why are these tuition and fee revenues kept separate from regular tuition and fee revenues at the UC? The answer is complicated. However, this separation adds a layer of confusion to an already complicated process and makes it difficult to do side by side funding comparisons. Increasing the transparency of both the CSU and the UC systems by using a common definition for “Core Revenues” would help the public understand the level of resources and their source and would help policy makers in constructing budgets.
The figure below shows that even when it comes to basic financial information, such as the amount of revenue collected from tuition, that the major reporting entities in the state calculate amounts inconsistently.
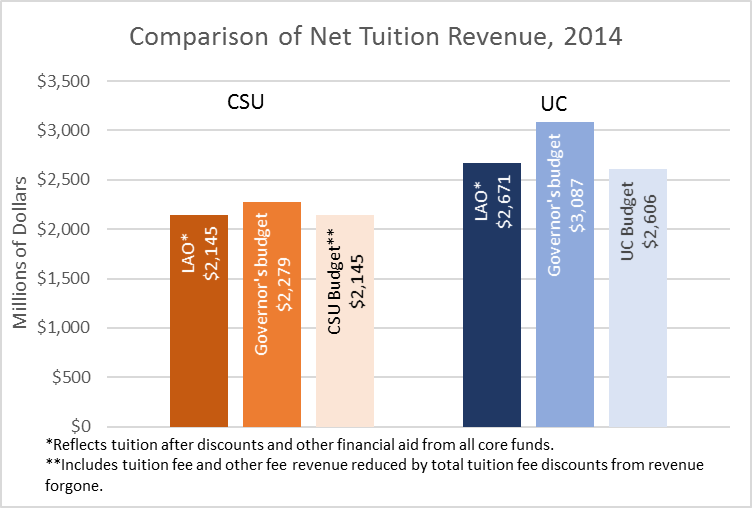
Sources: http://www.lao.ca.gov/reports/2015/budget/higher-education/hed-budget-analysis-022715.pdf; http://www.calstate.edu/budget/fybudget/2015-2016/executive-summary/documents/2015-16-Support-Budget.pdf; http://regents.universityofcalifornia.edu/regmeet/nov14/f1attach2.pdf Appendix 2; Department of Finance, Governor’s Budget 2015.
While inconsistent metrics can lead to confusion, missing metrics can create holes in our understanding about how these institutions function. For example, not all students who are admitted to UC and CSU eventually enroll for a number of reasons. Perhaps the student gets a better offer from a private institution or maybe he or she decides it would be cheaper to start at a community college. However, there is another reason that admitted students may not enroll. What if the student applied to UC Berkeley but was admitted to UC Merced, or applied to San Jose State but were admitted to Chico State? This process of admitting students but not to their original institution of application is called “referral” and no data is published on the number of students who are referred every year. Why is this important? Because it addresses whether or not the system is responding to student demand and what capacity the institutions have for accepting students. Our higher education institutions pride themselves on being unique and that means that they are not interchangeable. They are also located in different areas across the state, so admitting a student to an institution that may be far away from his or her family or job means that we are not meeting that student’s needs. To what extent is this process of referral happening – does it affect 5 percent of students who apply, or 30 percent? We do not know the answer to that question and this lack of information leaves us without a critical piece of the puzzle for gauging student demand and institutional capacity.
Critical pieces of financial data are missing, too. A common metric that corporations use to track personnel costs is the share of benefits as a percent of total compensation. This measure allows employers to analyze whether personnel costs are being driven by salaries versus benefits. This metric is not produced for public higher education institutions anywhere in California. It is possible to calculate this piece of data but it takes some Sherlock Holmes-level sleuthing to find for both UC and CSU. Why does it matter? Much of the public dialogue about higher education costs surround the idea of administrative bloat or outsized salaries. If personnel costs are actually being driven up because the benefits given to employees have just become more expensive over time, by increasing costs for health premiums, then that paints a different picture—and presents a different set of issues to address.
This call to make data more consistent and complete is not predicated upon a desire to shame institutions or create more busywork.
When the public, policymakers, and institutions of higher education themselves have an informed understanding of how our educational institutions are working and what financial realities they face, they are better able to make hard decisions about trade-offs.
Without consistent and meaningful metrics on student access, costs, spending, and student completion rates, we cannot assess if our institutions of higher education are fulfilling their mission of educating Californians and setting them up for success.
[1] Public Policy Institute of California, PPIC Statewide Survey Californians and Higher Education, December 2016.